cherry, cherry!

Memento coding

Saturday, 24 October 2020

Modelling society segregation with Schelling’s model

When thinking about math models, people usually think about some kind of abstract formula on a board or a sheet, nothing really near to everyday life. But you know what? They’re probably wrong.

Being a tech community member is a great experience and tech communities are a great way to describe a simple sociological phenomenon called “sorting”.

“Sorting” is a kind of behavior respecting which people just tend to spend their time with similar people (it can be a matter of economical status, ideology etc…) producing “segregation”. Schelling, an economist, first developed a model to formalize it.

According to Schelling’s model, people define a threshold (the percentage of people similar to them they want around) and just move away if the percentage of alike-people surrounding them is below that threshold. While people keep moving away, they induce other people to do the same in a “cascade effect” because their decisions affect others environment.

In this model, you have a percentage of unhappy people who want to change their location: they do this on a random basis and the algorithm just stops when the convergence to a percentage of 0 unhappy people is reached.

Now, an easy way to visualize how the model works is to use NetLogo, a simulation software. While running the simulation, NetLogo also keeps track of the percentage of unhappy people.

Setting up the simulation just produces a grid with a predefined density occupancy of people (90% in the following image).


Even if it is not explicitly pointed out, snooping into NetLogo simulation code it is possible to observe that in this “world” unhappy people who want to move away are marked with an “X”.

if visualization = "square-x" [
 ifelse happy? [ set shape "square" ] [ set shape "X" ]
 ]
Clicking the “go” button, the simulation starts until convergence is reached.


If you think about it, this result is quite counterintuitive: if someone only wants a 30% of people-alike around you can say that this person is pretty tolerant. Despite the micro-behaviour, the observable macro-behaviour leads to a really different conclusion (and that conclusion is somewhat…surprising!).


References:

Sunday, 30 August 2020

The late night tinkering projects # 11: Arduino + Flutter = 💙

Arduino Nano 33 Sense BLE comes with a lot of nice onboard sensors you can use to experiment and have fun.

This time, just to experiment with an onboard temperature sensor, you will try to publish a simple service to read temperature and to develop a very basic Flutter app to display the value on screen.

BLE for dummies

Without going into too much details, Bluetooth communication is similar to client/server communication.

The server (the BLE peripheral, Arduino in this case) makes data available to the client (the central device, the mobile phone in this case) in an exclusive way (i.e. the server can connect only to one device at time; the devices can be connected to multiple peripherals.

A characteristic is an attribute containing only a value:

https://www.bluetooth.com/specifications/gatt/characteristics/

it describes some kind of value that can be received from the device (i.e: the apparent wind speed, the heart rate lower limit…). Characteristics are stored in a lookup data table and are identified with a UUID.

A service is just a logical collection of characteristics:


for example “Alert notification service” or “Battery service”,“Environmental service” and so on…

The BLE peripheral advertises itself and when a central connects, the connection is established. From that moment, the communication can be bidirectional.

The Arduino Code


Comments in code should be enough to understand its behaviour. There is something that it can be useful to note: you are going to publish a standard “temperature” characteristic (0x2A6E) in a standard “Environmental sensing” service (0x181A).

Now on with the Flutter code.

The Flutter Code

The following is a very basic Flutter code to connect to 0x181A service to read read 0x2A6E (temperature) characteristic.

It makes use of FlutterReactiveBle package to use mobile device BLE.

What is worth to comment here is the ability to scan for specific advertising peripherals with specific scan modes:
_ble.scanForDevices(
  withServices: [],
  scanMode: ScanMode.lowLatency,
 _requireLocationServicesEnabled: true)
and the connection to a specific characteristic in a specific service:
final characteristic = QualifiedCharacteristic(
  serviceId: Uuid.parse("181A"),
  characteristicId: Uuid.parse("2A6E"),
  deviceId: device.id);
final response = await _ble.readCharacteristic(characteristic);
This is in fact a one-time read application because the code connects to the peripheral and then disconnects. If the user wants to read the sensor value again, another scan is required (ameliorable!).

And here’s the result!


Wednesday, 27 May 2020

The late night tinkering projects #10: fun with Fourier!

With some signal processing on Arduino, you can achieve some nice lights effects! Curious about the code? Check the source here!

One of the most common applications of lights effects is getting voice or music with a microphone and to light some led to obtain some nice visual effect.

In particular, the audio input is processed in order to get frequency and maybe to light some particular light when the music (or the voice) hit some particular (peak) frequency.

Surfing on sine wave: Fourier transform

No need to deep dive in math, Fourier transform shift the wave representation from time domain to frequency domain.

With Fourier, the wave is decomposed as a sum of sinusoids, each one with its own frequency, amplitude and phase (and the Fourier theorem itself states that this decomposition operation is possible for every wave). Since making a Fourier transform is heavy task, libraries usually perform Fast Fourier Transform, an optimized version of the Fourier Transform algorithm.

Source: wikipedia

To keep it simple, you usually feed the FFT with a wave and obtain an array of bins as an output, where each bin represent a frequency range and a value will be present in that bin if a signal within the bin frequency is present.

When dealing with FFT, there are some concepts developers have to deal with:
  • sampling frequency: must be at least twice the frequency we want to “capture” (due to Shannon-Nyquist theorem)
  • number of samples: to improve algorithm optimization, this number has to be in a power of 2. The higher this number, better the resolution (more bins->narrower frequency ranges)

From theory to practice

Arduino Nano 33 BLE Sense comes with nice on-board RGB leds and an integrated microphone so all is ready to experiment.

If you don’t have this particular Arduino nano, you can also connect your own lights and microphone.

To capture audio and detect the frequency, you are going to include two libraries:
#include <PDM.h> //to get microphone input
#include <arduinoFFT.h> //for the Fourier transform
The PDM library allows you to use PDM (Pulse-density modulation) microphones and that’s just the kind of microphone it’s possible to find on Arduino Nano 33 BLE Sense board; ArduinoFFT is a Fast Fourier Tranform library.

First of all, you define the sampling rate and the number of samples for FFT:
#define SAMPLES 256 //Must be a power of 2
#define SAMPLING_FREQUENCY 16000
Sometimes, searching for online examples, it’s possible to find “the must be less than 10000 due to ADC” warning comment, referred to SAMPLING_FREQUENCY. This is a limit that you can hit when reading input from pins (which is not this case), since reading from a pin requires a certain amount of time, thus limiting sampling rate.

In the setup function of the sketch, we are going to initialize leds, PDM and FFT with some more variable:
short sampleBuffer[SAMPLES];
volatile int samplesRead;

double vReal[SAMPLES];
double vImag[SAMPLES];

void onPDMdata(void);

const int ledPin = 22; //red
const int ledPin2 = 23; //green
const int ledPin3 = 24; //blue

void setup() {
Serial.begin(115200);

while (!Serial) {
; // wait for serial port to connect. Needed for native USB port only
  }

PDM.onReceive(onPDMdata);
PDM.setBufferSize(SAMPLES);

if (!PDM.begin(1, 16000)) {
Serial.println("Failed to start PDM!");
while (1);
}
pinMode(ledPin, OUTPUT);
pinMode(ledPin2 , OUTPUT);
pinMode(ledPin3, OUTPUT);

digitalWrite(ledPin, HIGH);
digitalWrite(ledPin2, HIGH);
digitalWrite(ledPin3, HIGH);
}
onPDMdata is a callback function invoked when data is available to be read from the microphone:
void onPDMdata()
{
int bytesAvailable = PDM.available();
PDM.read(sampleBuffer, bytesAvailable);
samplesRead = bytesAvailable / 2;
}
In the loop() function, you consume the sampleBuffer and calculate the FFT, requesting the peakFrequency(). You also define three additional function to light each and every led. Every led will be lit when the peak is in a particular predefined frequency range:
void lightOne() {
digitalWrite(ledPin, LOW);
digitalWrite(ledPin2, HIGH);
digitalWrite(ledPin3, HIGH);
}

void lightTwo() {
digitalWrite(ledPin, HIGH);
digitalWrite(ledPin2, LOW);
digitalWrite(ledPin3, HIGH);
}

void lightThree() {
digitalWrite(ledPin, HIGH);
digitalWrite(ledPin2, HIGH);
digitalWrite(ledPin3, LOW);
}


void loop() {
if (samplesRead) {
for (int i = 0; i < SAMPLES; i++) {
vReal[i] = sampleBuffer[i];
vImag[i] = 0;
}

FFT.Windowing(vReal, SAMPLES, FFT_WIN_TYP_HAMMING, FFT_FORWARD);
FFT.Compute(vReal, vImag, SAMPLES, FFT_FORWARD);
FFT.ComplexToMagnitude(vReal, vImag, SAMPLES);

double peak = FFT.MajorPeak(vReal, SAMPLES, SAMPLING_FREQUENCY);

Serial.println(peak);

if (peak <=600)
lightOne();
if (peak >600 && peak < 1200)
lightTwo();
if (peak >= 1200)
lightThree();
samplesRead = 0;
}
}

Testing

Reading the serial plotter you will see the peak frequency over the time.

Since it’s impossible to have complete quiet in the room you will see the plot moving around a certain frequency, depending on input sound and the light will probably be red.

To test the sketch...put your phones on Arduino!

Head on this site where there is a tone generator. Now let’s start by generating a wave with a frequency of 440Hz (A4):


You should see the plot around 440Hz in the serial plot.

Now go on moving the slide from 0 to 1400 Hz: you will see the red light before, then the green light and, exceeding 1200Hz, the blue.


Screenshot_1.png

You can have fun putting some music on and adjusting intervals to achieve nicer light effects!


Thursday, 9 April 2020

Linear programming in World of Warcraft: a quest of tailoring, skill and gold

Many video games problems can be modeled with math or solved with programming techniques: n-queens, secretary problem and many more are often encountered in-game!

In World of Warcraft, players can have profession skills: enchanting, tailoring, mining and many others that help gamers to raise money to buy in-game objects, to trade or to sell at the auction house.

As for real life, players have to train skills in order to gain proficiency and to craft more powerful (and valuable) objects.

Just to give you an example, as a tailoring beginner apprentice, you can tailor the following objects:


As you can see, every object require a different amount of materials (or different materials, too!).

The problem to maximize the amount of gold received by selling crafted items when a player has some amount of materials available is a typical linear programming problem.

In particular it is a blending model, i.e. a problem where the goal is to find the optimal way to mix some ingredients given some constraints, in order to minimize or maximize an “objective” function (a goal). Relationship between ingredients mixing is expressed as a linear function…and that’s why we call it “linear”.

Let’s consider the following availability: 20 linen cloth and 8 coarse thread.

We want to decide how to mix them in brown linen cloak or brown linen pants in order to maximize our income.

We also know that the first can be sold for 1 gold at the auction house and the latter can be sold for 3 gold (ok, it’s a lot for those two items, but let’s simplify!).

How can we model the problem?

Let’s define xc as the quantity of linen cloak to be crafted and of xb as the quantity of brown linen pants to be crafted.

We can observe the following facts:
  • the quantity xc must be integer and greater or equal to zero
  • the quantity xb must be integer and greater or equal to zero
  • the quantity of linen cloth used must be lesser than the linen cloth availability
  • the quantity of coarse thread used must be lesser than the coarse thread availability
We also know that:
  • 1 bolt of linen cloth is made up of 2 pieces of linen cloth.
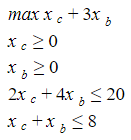
So the problem can be modeled in the following way:

Let’s graph those inequalities!


We can see that the overlapping planes identify a polyhedron and the fundamental theorem of linear programming states that the optimal solution is one of the vertex of that polyhedron.

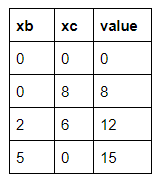
So that optimum can be one of the following points: (0,0) (0,8) (2,6) (5,0)

How can we say what’s the optimum? Just calculate the value of the max function in all those points!

To optimize the income we’d better produce 5 brown linen pants! ;)

And now…let’s go to quest! 🙌🙌🙌

Tuesday, 24 March 2020

Simulating routes on Android Emulator

It could be a Java Android project, a Flutter app or a Kotlin app but sometimes you just need to emulate routes along a certain path (maybe to test a location based service).

Android emulator offers a simple way to simulate routes, even if it’s not so publicized: it is in fact possible to import GPX/KML files.


Building your own route

Google Earth makes it possible to build and export KML files to be imported in the emulator.

Open Google Earth and point a place you would like to start the trip from, let’s say “Piazza del Popolo”, in Rome. Click on the “Polyline” tool and trace your route on the map.


Press Enter to save the line.


Choose a title for the route, a title for the project and select “New KML file in the dropdown”. Click on “Save”.


The polyline will be automatically added to a new project. Press on the three dot icon and choose “Export as KML file”.


Now you have a KML file to use in the emulator.

Emulating the route

Import the route in the emulator.


When you click on “Play route”, the location pointer will move along the route. You can try to open Google Maps in the emulator to verify that the route is being correctly emulated.

You can use Google Earth to compose more complex routes all around the city or...around the world, so have fun!


Friday, 20 March 2020

How to publish your GitHub pages on a domain

Publishing your GitHub pages is a two step process: you first configure GitHub and then set the DNS.

On GitHub

Assuming that you already pushed the website to GitHub, go to “Settings”.
If you already didn’t so, rename your repository as <mysite>.github.io: this will publish your repository as <mysite>.github.io.


Now scroll down to find the “GitHub Pages” section.
Publish the master branch:


Enabling HTTPS is not mandatory but is strongly suggested.


Specify your custom domain:
Now it’s time to create a special file in the root directory of the site repository, the CNAME file:


This file contains only one text row, specifying the pointing domain:

mysite.com

On DNS management

Before making changes, backup your current DNS configuration.

In your DNS management interface (I will refer to Aruba provider), add the following A records (as stated in this help page on GitHub), without specifying an host name:

185.199.108.153
185.199.109.153
185.199.110.153
185.199.111.153

If the www host is defined in A record remove it, because you are going to add it as CNAME record.

Now on to the CNAME records.
Add a www host, pointing to <mysite>.github.io. (replace <mysite> with the real name of your repository name): don’t forget to add the dot (.) at the end of the hostname!

If everything is ok, you should see a green banner in the Setting section of the published repository.


Please allow some hour to DNS to propagate and enjoy your website!

Bonus track: adding a subdomain

You can publish a subdomain like blog.mysite.com, creating and publishing another repository on GitHub with a CNAME file specifying the subdomain name as its content:

blog.mysite.com

In your DNS management interface, create another CNAME record with “blog” as hostname and pointing again to <mysite>.github.io. (dot included!)

GitHub will take care to publish the correct repository on the corresponding subdomain.

Tuesday, 17 March 2020

How to develop a backend for your Action using Heroku

Actions fulfillment can be done not only via Cloud Functions but also with a webhook.

Heroku is a nice free service you can deploy your backend on: porting Cloud Functions or Dialogflow inline editor fulfillment is pretty easy to do!

After creating a node.js project in Heroku, just change package.json as the following, to include AoG package:
 {  
  "name": "node-js-getting-started",  
  "version": "0.3.0",  
  "description": "A sample Node.js app using Express 4",  
  "engines": {  
   "node": "8"  
  },  
  "main": "index.js",  
  "dependencies": {  
   "actions-on-google": "^2.9.1-preview.1",  
   "ejs": "^2.5.6",  
   "express": "^4.15.2"  
  },  
  "devDependencies": {  
   "request": "^2.81.0",  
   "tape": "^4.7.0"  
  },  
  "repository": {  
   "type": "git",  
   "url": "https://github.com/heroku/node-js-getting-started"  
  },  
  "keywords": [  
   "node",  
   "heroku",  
   "express"  
  ],  
  "license": "Apache-2.0"  
 }
Now it’s time to change index.js, implementing a small express webserver with the following boilerplate code:
 'use strict';  
 const express = require('express')  
 const bodyParser = require('body-parser')  
 const path = require('path')  
 const PORT = process.env.PORT || 5000  
 const {dialogflow, HtmlResponse} = require('actions-on-google');  
 const app = dialogflow({debug: true});  
 <insert your intents fullfilment here>  
 express().use(bodyParser.json(), app).listen(PORT);
Replace the placeholder with intents fulfillment from inline editor or cloud function js file:
 app.intent('Welcome', (conv) => {  
 console.log('welcome');  
        conv.ask('Welcome!');  
  }  
 });  
Push the change to the Heroku repository and if you didn’t do so, take note of Heroku project URL (you can find it in project settings).

Back to Dialogflow, update the fulfillment URL with the one of the Heroku project:


Be careful to match the port number, too.

You can now use Dialogflow emulator to test Action behaviour!🙌🙌🙌